Issues:
Sectors:
Keywords:
1. Introduction
Countries and regions around the world are developing emissions trading systems as a means to place a price on greenhouse gas (GHG) emissions. Such programmes are now in place in Europe, North America, and parts of Asia – they are being considered in South America and several other regions. Given the difficulties of achieving consensus on climate change mitigation measures through the multilateral climate negotiations, momentum appears to have shifted from the international level to that of nation states and regions1. A particularly strong dynamic is visible in rapidly developing economies, with new trading systems under discussion or already being established in Brazil, China, India, and South Korea. The aim of this article is to provide an overview of existing and selected emerging GHG trading schemes worldwide.
2. Existing and emerging schemes
2.1 Overview of existing and emerging schemes
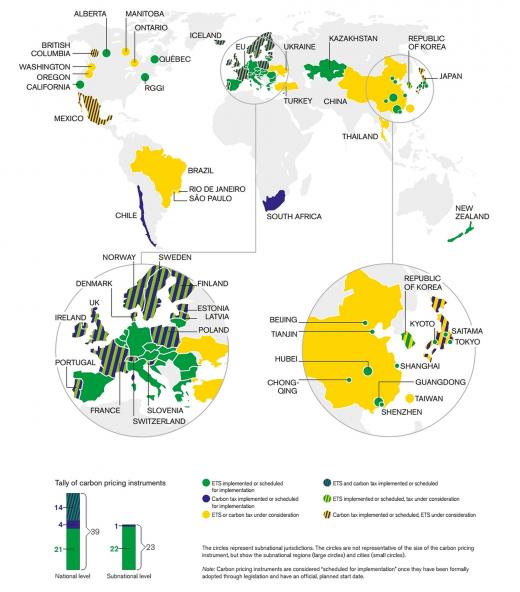
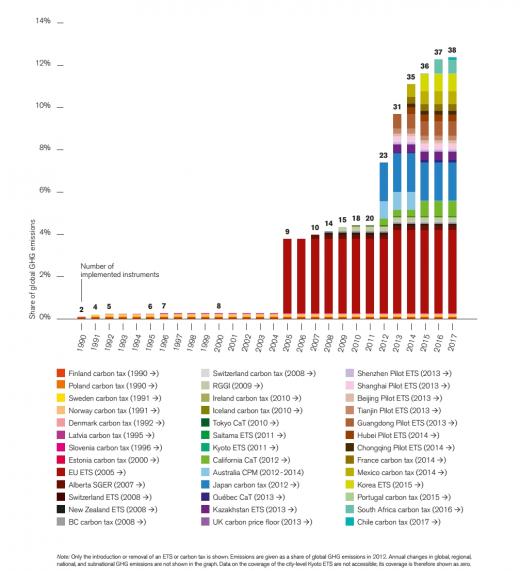
Globally, 39 national and 23 sub-national jurisdictions have implemented or are scheduled to implement carbon pricing instruments, including emissions trading systems and taxes2. The world’s largest carbon market is the European Emissions trading scheme (EU-ETS), covering sectors that emit over 2 billion tonnes of carbon dioxide each year. Korea's ETS covers sectors that emit over half a billion tonnes of GHG and the programme in California and Quebec covers sectors emitting nearly half a billion tonnes. The seven Chinese pilot emission trading systems collectively cover sources emitting over one billion tonnes of CO22.
National emission trading programmes have been discussed in the US and Canada, but have so far failed to receive the necessary political support. Instead, North American carbon trading systems have emerged at the regional level: nine US States have joined forces in a joint trading system called the Regional Greenhouse Gas Initiative (RGGI), and the Canadian province Quebec linked with California’s emissions trading programme in January 2014.
Asia has seen a strong dynamic toward emission trading recently, with five Chinese cities and two provinces starting pilot carbon markets – together, those regions account for about one-fourth of Chinese GDP and CO2 emissions. Chinese leaders are considering a national emission trading scheme, possibly beginning in 2016. South Korea’s emission trading programme entered into force in January 2015.
In other parts of the Asia Pacific region, the picture is mixed. The Tokyo Metropolitan Government has been operating a trading scheme for indirect CO2 emissions since 2010. However, Japan is not planning to implement a national emission trading system. While New Zealand’s small ETS has been operating since 2008, Australia abandoned a long-planned national ETS in 2013 after a change in government.
2.2 Snapshot of existing schemes with focus on China
The EU-ETS
In operation since 2005, the European Union Emissions Trading System (EU ETS) has faced a number of challenges resulting from the creation of the largest market for an environmental commodity in history. Currently, the EU ETS operates in 31 countries – all 28 EU Member States as well as Iceland, Liechtenstein and Norway – and covers CO2 emissions from emitters in the power sector, combustion plants, oil refineries and iron and steel works, as well as installations producing cement, glass, lime, bricks, ceramics, pulp and paper. More than 10 000 covered entities account for around 2 gigatonnes or 40% of EU total greenhouse gas emissions.
The New Zealand Emissions Trading Scheme (NZ ETS) entered into force in 2008 and is the only ETS to include forestry as a covered sector.
The Regional Greenhouse Gas Initiative (RGGI) is a carbon market among states in the northeastern and mid-Atlantic US that entered into force on January 1, 2009. It covers only CO2 emissions from electricity generation.
The Western Climate Initiative (WCI) is an initiative of US states and Canadian provinces to jointly develop climate change policies. Currently only California and Quebec have implemented emission trading systems, which entered into force on January 1, 2013;
The Tokyo Metropolitan Government Emissions Trading System (TMG ETS) was established in 2010. The targets energy-related CO2 emissions from industrial facilities as well as public and commercial buildings;
The Korean ETS began in January 2015 and covers over 60% of the country’s emissions. Over 500 companies (thousands of individual facilities) are covered in the power and industry sectors, but also waste and domestic aviation..
The Kazakhstan Emissions Trading Scheme started with a pilot phase in 2013 covering CO2 emissions. Energy, mining and metallurgy, chemicals, cement and the power sector are included.
The Chinese pilot trading schemes
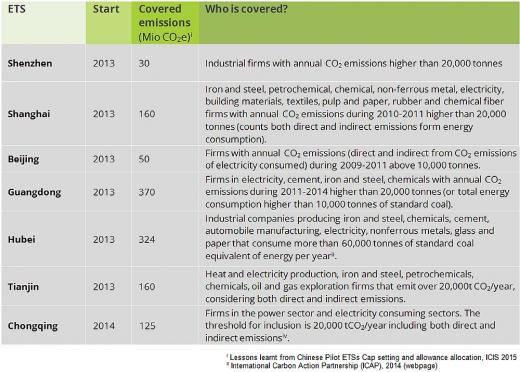
In 2011, the National Development and Reform Commission (NDRC) announced its plan to develop seven official ETS pilot programs in five cities (Beijing, Shanghai, Tianjin, Chongqing and Shenzhen) and two provinces (Guangdong and Hubei). Implementation of this plan began in 2013. In 2015 all programmes had entered into force – the Chinese national government’s plans to implement a national ETS will be informed by the experiences of these pilot programmes.
The following table gives an overview of Chinese ETS, their start, amount of covered emission and covered sectors.
The Chinese pilot programmes vary in terms of caps and targeted sectors. For example, Beijing is the only pilot that requires annual absolute emission reductions (quantifying the amount of carbon dioxide and other greenhouse gases reduced) for existing facilities in the manufacturing and service sectors3 4. The other ETS require reductions in emissions intensity, a ratio of emissions per unit of product. Shenzhen and Tianjin allow individual investors and entities that are not covered in the ETS, such as financial institutions, to participate in trading, resulting in higher trading frequency and potentially larger price fluctuations.
Allowances in the Chinese ETS pilots are generally given out for free, based on grandfathering. Apart from power and heat, benchmarking (an allocation method by which emitters receive allowances based on measures related to their size) has not been deployed at a large scale. However, two of the ETS pilots, Shenzen and Guangdong, started to experiment with a small amount of auctioning. As for offset credits (emission reductions resulting from projects undertaken by entities NOT covered by the ETS cap) all of the Chinese programmes are required to accept federally-approved offsets known as "Chinese Certified Emission Reductions" or CCERs. These mostly come from previous Chinese Clean Development Mechanism (CDM) projects under the Kyoto Protocol’s CDM. Indirectly, this opens a link between the pilots, as they have at least one type of compliance unit in common.
3. Comparison of design features of ETS worldwide
This article shows that existing and emerging trading schemes are very different regarding design features such as scope or allocation method.
Sectoral coverage: While the EU-ETS focuses on industry and large energy producers and ETS schemes in the US and Canada have similar coverages (with the exception that the linked California/Quebec programme also includes transport emissions), some of the emerging schemes in Asia involve smaller facilities, buildings, and indirect emissions from energy consumption.
Type of targets: While schemes in the US and Europe have absolute caps, the Chinese pilot ETS largely use an intensity metric for required reductions.
Allocation method: Only few ETS worldwide have a significant share of auctioning from the beginning. Similar to the EU-ETS where grandfathering (an allocation method by which emitters receive permits on the basis of their past emissions) was used in the beginning, the Chinese ETS pilots allocate most allowances for free.
4. Conclusions
Although neither the US nor Canada have national emission trading systems, they are home to regional carbon markets. At the same time various ETS are emerging at regional and national level are in Asia. Some of these differ from the ‘traditional’ schemes in industrialised countries (such as RGGI and the EU ETS), which mainly address emissions from heavy industry and the power sector. In contrast, some of the newer schemes involve smaller facilities or buildings and include indirect emissions from energy consumption. Given the current dynamics in Asia, the future of global emissions trading will depend on developments in Asia and, to a lesser degree, other parts of the developing world. If this dynamic continues, emerging economies could eventually overtake the European Union and other OECD countries as centres for emissions trading, which in turn would significantly shift the style, nature and challenges of a future international carbon market.


