Issues:
Sectors:
Keywords:
1. EU ETS: An instrument to reduce greenhouse gas emissions
The European Union Emissions Trading Scheme (EU ETS) is the world’s first and so far the largest installation-level ‘cap-and trade’ system for cutting greenhouse gas (GHG) emissions. The system is intended to assist the EU in reaching both its immediate as well as longer-term emissions reduction objectives by “promoting reductions of emissions in a cost-effective and economically efficient manner”1.
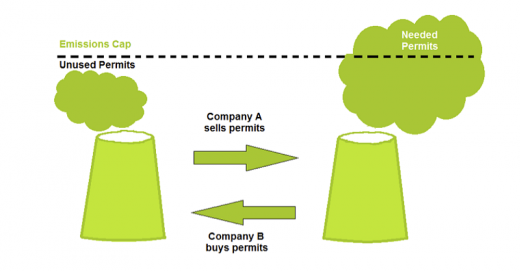
The main features of the EU ETS are the emission cap (a ceiling on the maximum amount) and the trading of EU emission allowances (EUAs). The cap guarantees that total emissions are kept to a pre-defined level (and does not rise above it – in the period for which the cap applies). Covered installations have to submit an EUA for each tonne of carbon dioxide equivalent (CO2 eq) they emitted during a year.
EUAs are allocated for free or they are auctioned. The trading system offers flexibility to the businesses covered by the scheme as they can decide on taking action or buying EUAs depending on the EUA price. Emitters who have reduction costs lower than the price are encouraged to take action. Emitters with high reduction costs can buy EUAs and postpone their own action thereby complying with the GHG policy more cheaply than they otherwise would have been able to (if, for example, all emitters had to cut emissions by the same ratio).
For accurate tracking of EUAs, participants of the EU ETS open up an account in the Union registry. Anyone possessing an account is able to buy or sell EUAs irrespective of whether they are covered by the EU ETS or not. Trading does not require brokers and can be directly conducted by buyers and sellers through organized exchanges or via intermediaries.
2. A brief history of the EU ETS
The origins of the EU ETS can be traced back to 1992 when 180 countries agreed to avoid dangerous level of human made global warming and signed the United Nations Framework Convention on Climate Change (UNFCCC). As a means of specifying action to be taken as part of this global joint effort, the Kyoto Protocol (KP) was consequently agreed upon in 1997. The KP introduced two principles essential for the establishment of the EU ETS:
- It contained absolute quantitative emission targets for industrialised countries and
- Included a set of so-called flexible mechanisms, which allowed for the option to exchange emission units between countries as an International Emissions Trading system.
The EU (then consisting of only 15 Member States) agreed jointly under the Protocol to an 8% reduction of GHG emissions from 1990 levels in the period 2008 to 2012 (read more: Overview of climate targets in Europe). At that point in time, it however, lacked the policy instruments to bring about this reduction. Internal debates on plans to introduce a carbon or energy tax had not proven to be successful.2 Several countries were moving ahead with national emission reduction policies (such as support for renewable energy), but others were waiting for common and coordinated policies and measures to be introduced EU wide (read more: European Climate Policy - History and State of Play). In this general context, the European Commission (EC) started elaborating a proposal for an EU emission trading system to tackle the emissions from key economic sectors (especially energy and industry). As a result of these deliberations, the EU ETS was instituted as one of the key policy measures to reach the Kyoto targets. Currently, it covers the 28 MS and since 2008, the neighbouring countries of Iceland, Lichtenstein and Norway.
There EU ETS is organised in trading periods (or phases), of which four are currently decided and more may follow. Currently the system is in its third period. Each of the four is described below as follows:
2.1 Phase 1: 2005-2007
The European Parliament (2003) passed a law3 to4 set up the EU ETS in October 2003 and regulated the first and second trading phase. The first phase of the EU ETS was a pilot phase to test the system. The Member States had the freedom to decide on how many EUAs to allocate in total as well as to each installation in their territory by preparing national allocation plans (NAPs). Almost all EUAs were allocated for free and were based on historic emissions called grandfathering. In this phase, CO2 emissions were covered from installations for power and heat generation and in energy intensive industrial sectors like iron, steel, cement and oil refining, etc. The penalty imposed on the companies for non-compliance was 40 Euro per tonne of CO2.
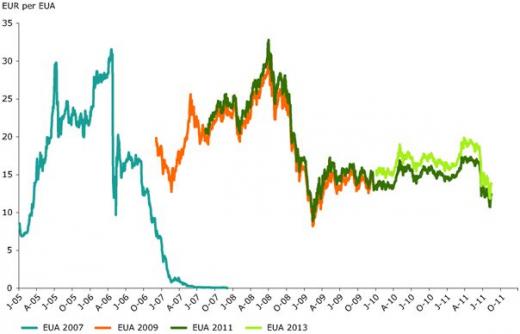
This initial phase was able to establish a price for EUAs, free trade throughout the EU and the infrastructure for monitoring, reporting and verifying (MRV) actual emissions from the covered installations. Approximately 200 million tonnes of CO2 or 3% of total verified emissions were reduced due to the ETS at nominal transaction costs.5 However, after the first year of operation, when real world emission data started to be published for the first time, it became obvious that too many EUAs had been allocated to businesses, leading to an oversupply of EUAs and a consequent fall in their price, eventually to zero at the end of the period (see Figure 2).6
2.2 Phase 2: 2008-2012
Since phase two was concurrent with the first commitment period of the Kyoto Protocol, the EU imposed a tighter emission cap by reducing the total volume of EUAs by 6.5% compared to 2005. In this phase Iceland, Norway and Liechtenstein joined the EU ETS and the scope was amended to include nitrous oxide from nitric acid production from several Member States. In addition, from 1 January 2012 onwards, the scheme also included flights within the borders of the EU ETS countries. Up to 10% of the allowances could be auctioned by the Member States instead of free allocation. The penalty for non-compliance rose to 100 Euro per tonne of CO2eq. Businesses were allowed to use credits from the Kyoto Protocol’s Clean Development Mechanism (CDM) and Joint Implementation (JI) leading to a total of 1.4 billion tons of CO2 equivalent credits on the market (with the exception of those for nuclear facilities, agricultural and forestry activities)7. This move was meant to offer cost-effective mitigation options to businesses and it made the EU ETS the main driver of the international carbon market. Yet, the additional credits and the economic crisis of 2008, which reduced emissions from EU companies, resulted in a large surplus of EUAs, causing a fall of the price from 30 Euro to less than 7 Euro. Figure 2 illustrates how the prices of EUAs have fluctuated over the years and how it fell to zero during the peak of the crisis.
2.3 Phase 3: 2013-2020
The EC (2009) revised the EU ETS for the third phase.8 The reasons for these modifications were manifold. Firstly, the fall of EUAs during phase two greatly undermined the reliability of the EU ETS. Secondly, the EU ETS did not generate substantial transformations or movement towards renewable energy industries or low carbon technologies as was expected. Thirdly, it was not as cost-effective as initially anticipated. Lastly, it was subjected to several frauds and scams. To deal with the inherent weaknesses of the system, the changes introduced in this phase particularly include the emission cap applying uniformly over the EU to achieve the GHG reduction target more effectively. The cap decreases by 1.74% per year to reduce emissions by 21% in 2020 compared to 2005.
The main allocation method was modified from grandfathering to auctioning as a principle and some remaining free allocation based on benchmarks. In 2013, allowances for more than 40% of all verified emissions were auctioned. The auctioning platforms are accessible to any country that participates in the EU ETS although the auctions take place at a national level. The process of auctioning is supervised by the EU ETS Auctioning Regulation to ensure that they are conducted in an open, transparent, harmonised and non-discriminatory manner. The amended EU ETS Directive instructs that auctions must match criteria like predictability, cost-efficiency, and fair access to auctions and simultaneous access to relevant information for all operators.9
Free allocation applies to industrial installations other than for power generation based on benchmarks (BMs). A BM determines the number of free EUAs based on the installation’s output (or input). There is a BM for each product such as for steel, cement or lime. The installations received 80% of the EUAs they would get according to the BM-allocation. This level will be reduced annually to 30% in 2020. Industries at risk of carbon leakage receive 100% of the BM- allocation over the whole trading period.
The main challenge in the third trading period is the large surplus of EUAs transferred from the second to the third trading period leading to an EUA price of only 3-7 Euro. The EU therefore decided to postpone the auctioning of 900 million EUAs to the end of the trading period (so-called backloading, which was adopted only after a drawn out and controversial political process).10 In addition, the European Commission proposed a market stability reserve to be implemented in the next trading period, which should balance demand and supply by adjusting auctioning volumes.11
2.4 Phase 4: 2021-2018
This phase will begin 1 January 2021 and finish on 31 December 2028 wherein the EC intends to conduct a full review of the EU ETS Directive by the year 2026. In January 2014, the EC had put forward a legislative proposal for a Market Stability Reserve (MSR) as a part of their proposed policy framework for climate and energy for 2030. It had also given indications that it might tighten the EU ETS cap further.
3. Conclusions
The EU ETS, a cap and trade system for GHGs from energy and industry, was implemented to ensure that the EU would achieve its GHG emission targets in a cost-effective manner. The system offers flexibility to businesses covered by the scheme as they have the choice between reducing emissions and purchasing emissions from other companies depending on the price of carbon. This promotes the realisation of cheap GHG reductions while the costly reduction measures can be postponed.


