Climate Policy Info Hub Home Link

Main menu

  • Issues & Sectors
  • About

Climate Policy Info Hub

Scientific Knowledge for Decision-Makers

Progress towards the 2020 Greenhouse Gas Target in Europe

  • Generate PDF
PDF

Issues: 

  • EU Climate Policy
  • Emission Trading
  • Renewable Energy

Keywords: 

  • 2020
  • economic crisis
  • implementation
  • non-ETS
  • targets
twitter share facebook share linkedin share
Progress towards the 2020 Greenhouse Gas Target in Europe | Fotolia © Olivier Le Moal
There has been considerable progress until 2013 towards the EU’s 2020 climate objective of a 20% reduction. Both, the Emission Trading Scheme (ETS) and non-ETS sectors have contributed to the development, especially renewable energy deployment. Part of the progress has to be attributed to the emissions reductions triggered by the economic crisis. Member States have also introduced climate policies that affect emission levels.

1. 20% emission reductions until 2020 within reach

The European Union (EU)’s climate strategy for 2020 established the target of a 20% reduction of greenhouse gas emissions (GHG) compared to the level of 1990. The overall emissions reduction target is separated into an EU-wide target for large industrial installations, covered by the European Emissions Trading Scheme (EU ETS) and one target for so called non-ETS emissions, covering households, buildings, transport, agriculture, services and smaller industrial installations. Non-ETS emissions are broken down into binding national targets for all of the 28 Member States (MS) by the Effort Sharing Decision  (ESD). The EU ETS is expected to deliver a 21% reduction of its emissions and the non-ETS sectors 10% (both compared to 2005 levels). Together this will accomplish a cut of 20% of overall emissions compared to 1990 levels.

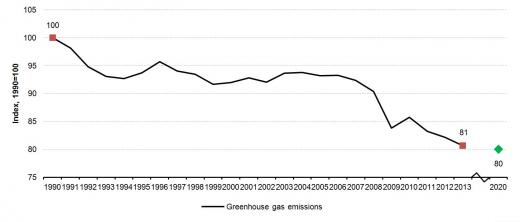
Overall, the EU has already reduced its emissions by 19% in 2013 (see Figure 1) and thereby almost already achieved its 2020 target eight years ahead of time1. The figure includes emissions from international aviation but excludes emissions from land use, land use change, and forestry (LULUCF), as also does the 20% target. Moreover, only GHGs emitted on EU territory are considered. So called embedded emissions – emissions caused by the consumption of imported goods produced outside the EU – are not included2 3.

2020 target almost achieved eight years ahead of time
Development of GHG emissions in the EU-28
2020 target almost achieved eight years ahead of time Development of GHG emissions in the EU-28 Figure 1: Total emissions, including international aviation, but excluding emissions from land use, land use change, and forestry (LULUCF) have been on a downward trend over the last decades Source: based on Eurostat data, online data code: t2020_30
Figure 1: Total emissions, including international aviation, but excluding emissions from land use, land use change, and forestry (LULUCF) have been on a downward trend over the last decades
Source: based on Eurostat data, online data code: t2020_30

2. Causes for emission reductions are multifaceted

During the 1990s emissions were mainly reduced due to structural changes in the European economies from heavy manufacturing towards more service-based economies and a change from coal to a higher share of gas in the energy mix4. From the mid-1990s onwards, also European climate policies started impacting emission levels.

At the end of the first decade of the new millennium large reductions of GHG emissions were triggered by the economic crisis. From 2008 to 2009 GHG emissions decreased sharply by 7.3 %5. After a rebound in 2010, emissions declined further, partly due to low heating demand because of a mild winter, reduced road transport in the countries affected by the recession, lower industrial output, especially of iron, steel and cement, as well as a negative gross domestic product (GDP) growth in 2012. Also lower emissions from energy production in Germany, Italy and UK contributed to the latest decline6  7. However, the decline of CO2 emissions observed during the 2009 to 2012 period can also be attributed to two further factors: the improvement of the primary energy intensity of the EU economy and the development of renewables, while the economic slowdown accounts for less than a half of the total emission reductions achieved during this period8.

The share of renewable energies in final energy consumption increased steadily over the past decade, moving Europe from 8.3% in 2004 to 14.1% in 2014 and heading towards the 20% target in 2020. Especially in the electricity sector, the strong growth in renewable energy deployment - particularly wind, solar and biomass - and the resulting higher share of renewables in electricity production contributed to the registered emissions reduction9. Research that looked specifically at the period prior to the economic crisis shows a contribution by renewables of several percentage points of emissions reductions in many Member States.10

3. Both ETS and non-ETS targets are projected to be reached

Emissions covered by the EU ETS increased marginally between 2005 and 2007, declined in 2008, and have stabilised below 2008 levels since then10. Between 2005 and 2013, ETS emissions decreased by 19 % (already taking into account the change in ETS scope)11. The latest reference scenario from the European Commission projects a reduction in these sectors of 24% from 2005 levels by 2020, which would exceed the target by 3 percentage points12.

Regarding non-ETS emissions, 2013 emission levels of the EU-28 were at about 2,641.5 million tonnes CO2eq, which corresponds to a reduction nearly 10% compared to 2005 levels. This means that the EU has nearly fulfilled its non-ETS target seven years early. Current projections for 2020 estimate that the EU-28 will overachieve its 2020 non-ETS objective by 1% with existing measures and by 4% with additional measures13.

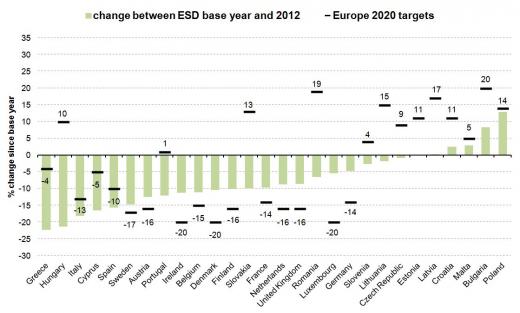
17 EU Member States fulfill national 2020 targets in 2012
Change in greenhouse gas emissions in non-ETS sectors
17 EU Member States fulfill national targets in 2012   Change in greenhouse gas emissions in non-ETS sectors Figure 2: Depiction by country, ESD base year–2012 (change ESD base year-2010 for HR).  Source: based on Eurostat data, online data code: t2020_35
Figure 2: Depiction by country, ESD base year–2012 (change ESD base year-2010 for HR).
Source: based on Eurostat data, online data code: t2020_35

Figure 2 shows the development of national non-ETS emissions of the Member States between ESD base year and 2012, as well as their 2020 non-ETS targets. 13 Member States have positive targets; all of them remained below their commitment so far. 15 countries have GHG reduction targets of which 4 already fulfilled their 2020 goals in 2012. Luxemburg is the furthest from its target, followed by Denmark, Germany and Ireland.

4. Further policy measures needed in several Member States

According to the European Environmental Agency (EEA), 15 Member States are expected to meet their national non-ETS targets through existing policy measures. 13 Member States will need to use additional measures (already in place in some countries), e.g. energy efficiency measures in the residential and services sectors, or make use of flexibility mechanisms to achieve their 2020 targets. Flexibility mechanisms allow the Member States to transfer parts of assigned allocations to subsequent years and to other Member States. Moreover, it is possible to realise emission reductions by submitting credits from the United Nations Framework - Convention on Climate Change (UNFCCC) regulated offset projects (under clean development mechanism (CDM) and joint implementation (JI)) up to a limit of 3% of non-ETS GHG emissions in 2005 – every year. For Austria, Belgium, Finland, Ireland, Luxembourg and Spain the EEA expects even additional measures not to suffice to reach the 2020 non-ETS targets and thus proposes further efforts and the use of flexibility mechanisms14.

5. Most sectors reduced GHG emissions from 1990 to 2012

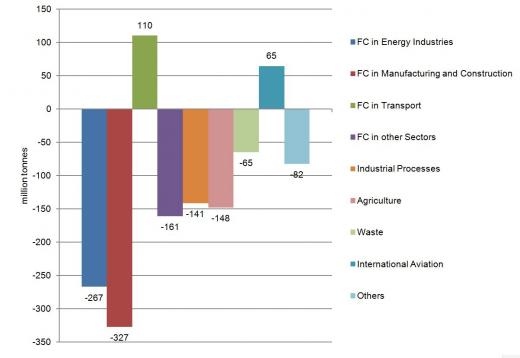
Figure 3 shows that nearly all sectors contributed to a reduction of GHG emissions from 1990 to 2012. In absolute terms, emissions from fuel combustion (FC) in manufacturing and construction, as well as in energy industries were reduced most with 328 and 267 million tonnes CO2eq respectively. On the other hand, emissions from transport increased by 14% making it now the second largest contributor with 19% of total GHG emissions. However, transport emissions peaked in 2007 with 989 million tonnes CO2eq and have been slowly declining ever since. The rise in transport emissions until 2007 can be largely attributed to growing transport volumes which more than offset efficiency improvements15. Recently, transport emissions were slightly declining which may be a result of reduced transport volumes due to the economic crisis, as well as high fuel prices16.

GHG emissions from transport and international aviation are increasing
Changes in GHG emissions of the EU-28 from 1990 to 2012 by sector
GHG emissions from transport and international aviation are increasing   Changes in GHG emissions of the EU-28 from 1990 to 2012 by sector Figure 3: The figure shows that nearly all sectors contributed to a reduction of GHG emissions from 1990 to 2012, except transport and international aviation.
Figure 3: The figure shows that nearly all sectors contributed to a reduction of GHG emissions from 1990 to 2012, except transport and international aviation.
Source: EEA, “EEA greenhouse gas – data viewer”, Website Section, (last accessed on 25 June 2014), online available at: http://www.eea.europa.eu/data-and-maps/data/data-viewers/greenhouse-gase...

More than 60% of emissions from “fuel combustion in other sectors” (FC in Other Sectors) takes place in the residential sector in 2012; the rest includes use for commercial/institutional purposes, as well as for agriculture, forestry and fisheries. Improvements from 1990 to 2012 have been distributed quite evenly over these sub-sectors17. Emissions from international aviation have nearly doubled from 1990 to 2012.

6. Despite recent emission reductions, further effort is needed

Altogether the EU significantly reduced its GHG emissions since 1990 and is already very close to achieving its 2020 climate target. However, the driving forces behind this development are multifaceted. The largest decrease of GHG emissions in the period between 1990 and 2012 took place during the peak of the economic crisis with reductions of 7.3% in 2009 alone. The economic slowdown reduced industrial output and transport volumes. Also regarding the most recent reductions, parts of the development are due to the slow recovery of MS after the economic crisis and also one time effects such as the mild winter of 2010/2011. Moreover, a larger share of service industries, as well as imported consumer goods contributed to emissions reductions within the EU, but led to an increase of emissions in third countries18. Nevertheless, European climate policies have contributed to reduced emission levels, especially through the introduction of renewable energies and energy efficiency policies – effects that will be retained even under higher future economic activity. A continuation of the downward trend will, however, depend on further efforts to bring about structural changes that create a transformation towards a low-carbon economy.

Sources
  • 1. EEA, “Trends and Projections in Europe 2014”, Tracking progress towards Europe’s climate and energy targets until 2020, EEA report No. 6 (Copenhagen: EEA, 2014), page 42. Online available at: http://www.eea.europa.eu/publications/trends-and-projections-in-europe-2014
  • 2. Eurostat, “Climate Change – Driving Forces.” Eurostat Statistics Explained, Website Section, (last accessed 26 June 2014), online available at: http://epp.eurostat.ec.europa.eu/statistics_explained/index.php/Climate_...
  • 3. Consumption-based emissions are the subject of another EU-funded project called Carbon-CAP. More details can be found online at www.carboncap.eu
  • 4. Eurostat, “Smarter, greener, more inclusive? – Indicators to support the Europe 2020 strategy”, 2013. Online available at: http://epp.eurostat.ec.europa.eu/portal/page/portal/europe_2020_indicato...
  • 5. Eurostat, online data code: t2020_30
  • 6. EEA, Annual greenhouse gas inventory 1990–2011 and inventory report 2013. EEA Report No. 8/2013, (Copenhagen: EEA 2013, p. 6). Online available at: http://www.eea.europa.eu/publications/european-union-greenhouse-gas-inve...
  • 7. EEA, Annual greenhouse gas inventory 1990–2012 and inventory report 2014. EEA Report No. 9/2014, (Copenhagen: EEA 2014, p. viii). Online available at: http://www.eea.europa.eu/publications/european-union-greenhouse-gas-inve...
  • 8. EEA, Why did GHG emissions decrease in the EU between 1990 and 2012?, 2014. Online available at: http://www.eea.europa.eu/publications/why-are-greenhouse-gases-decreasing
  • 9. EEA, “Trends and Projections in Europe 2013”, Tracking progress towards Europe’s climate and energy targets until 2020, EEA report No. 10 (Copenhagen: EEA, 2013), 52. Online available at: http://www.eea.europa.eu/publications/trends-and-projections-2013
  • 10. a. b. Bernd Meyer and Mark Meyer, “Impact of the current economic instruments on economic activity”, Understanding the Existing Climate Policy Mix, Online available at http://cecilia2050.eu/system/files/CECILIA2050%20Task%202.6.%20%20-%20Ec...
  • 11. EEA, “Trends and Projections in Europe 2014”, Tracking progress towards Europe’s climate and energy targets until 2020, EEA report No. 6 (Copenhagen: EEA, 2014), page 42. Online available at: http://www.eea.europa.eu/publications/trends-and-projections-in-europe-2014
  • 12. European Commission, “EU Energy, Transport and GHG Emissions Trends to 2050”, Reference Scenario 2013, (Brussels: European Commission 2014). Online available at: http://ec.europa.eu/energy/observatory/trends_2030/doc/trends_to_2050_up...
  • 13. EEA, “Trends and Projections in Europe 2014”, Tracking progress towards Europe’s climate and energy targets until 2020, EEA report No. 6 (Copenhagen: EEA, 2014). Online available at: http://www.eea.europa.eu/publications/trends-and-projections-in-europe-2014
  • 14. EEA, “Trends and Projections in Europe 2014”, Tracking progress towards Europe’s climate and energy targets until 2020, EEA report No. 6 (Copenhagen: EEA, 2014), page 42. Online available at: http://www.eea.europa.eu/publications/trends-and-projections-in-europe-2014
  • 15. Viktoria Bolla and Velina Pendolovska, Driving forces behind EU-27 greenhouse gas emissions over the decade 1999–2008, Statistics in Focus 10/2011, (Luxembourg: Eurostat, 2011, p. 5). Online available at: http://epp.eurostat.ec.europa.eu/cache/ITY_OFFPUB/KS-SF-11-010/EN/KS-SF-...
  • 16. Eurostat, “Smarter, greener, more inclusive? – Indicators to support the Europe 2020 strategy”, 2013. Online available at: http://epp.eurostat.ec.europa.eu/portal/page/portal/europe_2020_indicato...
  • 17. EEA, “EEA greenhouse gas – data viewer”, Website Section, (last accessed on 25 June 2014), online available at: http://www.eea.europa.eu/data-and-maps/data/data-viewers/greenhouse-gase...
  • 18. Eurostat, “Climate Change – Driving Forces.” Eurostat Statistics Explained, Website Section, (last accessed 26 June 2014), online available at: http://epp.eurostat.ec.europa.eu/statistics_explained/index.php/Climate_...
Related Knowledge Package(s) 
European Climate Policy - History and State of Play
Renewable Energy Support Policies in Europe
The EU Emissions Trading System: an Introduction
Further Readings 
  • EEA, Annual greenhouse gas inventory 1990–2012 and inventory report 2014. EEA Report No. 9/2014, (Copenhagen: EEA 2014), available at: http://www.eea.europa.eu/publications/european-union-greenhouse-gas-inve....
  • EEA, “Trends and Projections in Europe 2014”, Tracking progress towards Europe’s climate and energy targets until 2020, EEA report No. 10 (Copenhagen: EEA 2013), available at: http://www.eea.europa.eu/publications/trends-and-projections-in-europe-2014.
  • Eurostat, “Smarter, greener, more inclusive? – Indicators to support the Europe 2020 strategy”, 2013, available at: http://epp.eurostat.ec.europa.eu/portal/page/portal/product_details/publ....  
  • Nils Meyer-Ohlendorf, Matthias Duwe, Katharina Umpfenbach, Keighley McFarland, The Next EU Climate and Energy Package – EU Climate Policies after 2030, Forthcoming 2014, available at: http://www.ecologic.eu/de/11046.
  • Sebastian Oberthür and Marc Pallemaerts, The New Climate Policies of the European Union – Internal Legislation and Climate Diplomacy, (Brussels: VUBPRESS Brussels University Press 2010).
  • CECILIA2050 Policy Brief Nr. 2, available at http://cecilia2050.eu/publications/briefs
Author 
Andreas Prahl
Editors 
Andrzej Blachowicz
Matthias Duwe
Knowledge Package Citation 
Andreas Prahl (2014): “Progress on the 2020 Climate Target in Europe”. Climate Policy Info Hub, 14 November 2014. Online available at: http://climatepolicyinfohub.eu/progress-towards-2020-greenhouse-gas-target-europe
  • Log in to post comments
  • PDF

Issues & Sectors

The Climate Policy Info Hub has been created within the POLIMP project which has received funding from the European Union's Seventh Framework Programme for Research, Technological Development and Demonstration under Grant Agreement Number 603847.

POLIMP Project Logo

Legal Notice • Privacy Notice • Glossary