Climate Policy Info Hub Home Link

Main menu

  • Issues & Sectors
  • About

Climate Policy Info Hub

Scientific Knowledge for Decision-Makers

Household Contribution to Buildings' Carbon Footprint

  • Generate PDF
PDF

Issues: 

  • Energy Efficiency
  • EU Climate Policy

Sectors: 

  • Energy
  • Household

Keywords: 

  • consumption
  • electricity generation
  • emissions
  • global climate
  • greenhouse gas emissions
  • policies
  • targets
twitter share facebook share linkedin share
Fotolia © Brian Jackson
Households remain one of the most significant contributors to greenhouse gas emissions from the building sector, due to their energy consumptions, with certain Member States having thrice or more the household emission footprint than others. The efforts carried out to minimize their emissions have brought certain results, but more actions are considered necessary. Improvement of households' energy efficiency is a key parameter in this respect.

Climate policy mainstreaming means that actors whose main tasks are not directly concerned with mitigation of, or adaptation to, climate change also work to attain these goals. In this respect, the EU budget related to climate change is largely integrated into the various policy areas such as energy, agriculture or transport. Households' affiliation with greenhouse gas (GHG) emissions mainly derives as a result of energy use in residential buildings, and to a small percentage of the waste produced. In this respect, the next sections examine the connection between energy use and GHG emissions from the household sector, as well as the progress realized in the field of energy efficiency in the sector.

1. Households responsible for one quarter of total energy consumption and greenhouse gas emissions

1.1. Energy consumption in Europe is increasing

According to Eurostat, households have had a steady contribution of approximately 25-27% to the final energy consumption since 1995, with a small drop in 2011 (24.7%).1 Energy consumption in households is the main reason for the observed GHG emissions of the sector. However, although the relation of total energy consumption with GHG emissions is a direct one, the contribution of electricity consumption in the GHG generation, compared to other fuels used for thermal purposes mainly, is much more significant, compared to its percentage in the total energy consumption. Final electricity consumption in the residential sector in the first 27 Member States (MS) of the European Union (EU-27) is on the rise and relevant policy efforts are mainly concentrated on promoting energy efficiency in electricity using household appliances and equipment2. An overview of the relation of the total energy consumption, in contrast to the corresponding electricity consumption, is provided in the figure below for year 2011.
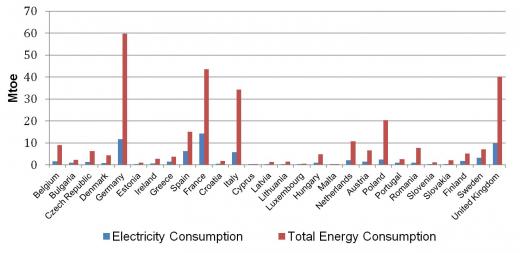
German, British and French households have highest energy consumption
Total energy and electricity consumption in households in 2013 (Mtoe)
German, British and French households have highest energy consumption | Total energy and electricity consumption in households in 2013(Mtoe) | Figure 1: Electricity and total energy consumption in households of the European Union of 28, in 2013 | Source: Eurostat database available at http://epp.eurostat.ec.europa.eu/portal/page/portal/energy/data/database (own extrapolation)
Figure 1: Electricity and total energy consumption in households of the European Union of 28, in 2013
Source: Eurostat database available at http://epp.eurostat.ec.europa.eu/portal/page/portal/energy/data/database (own extrapolation)

1.2. European regions show different consumption behaviour

Based on the Eurostat data available for the households' electricity consumption3 during the period 2000-2012, 3 major groups of countries may be identified. The first group with the highest electricity consumptions of over 10 Mtoe, comprises France, Germany and the United Kingdom (UK). The second group, with consumptions in the range of 2.8-6.5 Mtoe, includes Spain and Italy, followed by Sweden and Norway. The first two countries exhibit an increasing trend in electricity consumption patterns, while the latter two exhibit stabilization and even decreasing consumption patterns. Finally, the rest of the European countries mainly remain below 2 Mtoe. Regarding total household energy consumption, variations are observed among the patterns, with Germany and the UK leading the group, closely followed by France and Italy, while Poland, Spain and the Netherlands lag behind them, the rest of the countries have a total consumption of below 10 Mtoe. Dividing the above mentioned figures by the number of dwellings in each MS, an illustration of energy-intensive countries at normalized climate regarding the residential sector can be created, as presented in Figure 2, below. It is obvious from this figure that the countries leading the total energy consumptions are not the ones with the highest consumption per dwelling.

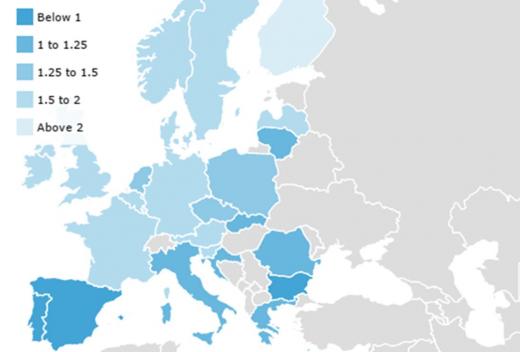
Luxembourg, Finland and Austria are most energy intensive per household
Energy consumption in households in 2012
Luxembourg, Finland and Austria are most energy intensive per household | Energy consumption in households in 2012 | Figure 2: Consumption in toe per dwelling scaled to EU average climate in 2012 | Source: ODYSEE Database, ODYSSEE-MURE Project, available at http://www.indicators.odyssee-mure.eu/
Figure 2: Consumption in toe per dwelling scaled to EU average climate in 2012
Source: ODYSEE Database, ODYSSEE-MURE Project, available at http://www.indicators.odyssee-mure.eu/

Based on Figure 2, the countries leading the total energy consumption per dwelling are mostly in the north and central EU, with the exception of countries such as Poland, Latvia, Lithuania and Slovakia. A common characteristic of these countries is that their gross domestic product (GDP) per capita is below EU average, and thus have lower financial ability to cover their energy needs.

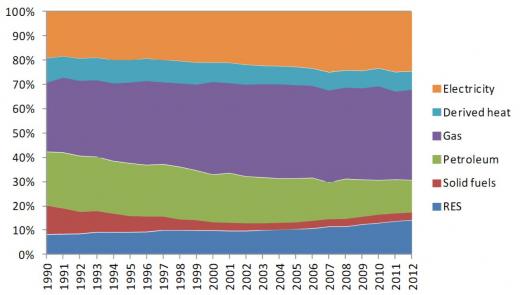
Figure 3 below presents the evolution of the different fuels' contribution in the households' final energy consumption for the EU-27. Evident is the growing share of electricity, gas and renewable energy sources (RES), accompanied by a decreasing trend especially in the petroleum products and solid fuels, and less abrupt as concerns derived heat.

Electricity, gas and renewables shares are growing
Electricity consumption in households from 1990 to 2012
Electricity, Gas and Renewables shares are growing | Electricity consumption in households from 1990 to 2012 | Figure 3: Dataseries of fuels’ contribution in the EU-27 household sector final consumption | Source: Eurostat database available at http://epp.eurostat.ec.europa.eu/portal/page/portal/energy/data/database (own extrapolation)
Figure 3: Dataseries of fuels' contribution in the EU-27 household sector final consumption.
Source: Eurostat database available at http://epp.eurostat.ec.europa.eu/portal/page/portal/energy/data/database (own extrapolation)

Therefore, any policy measures to be adopted for the reduction of the households' energy and electricity consumption, and thus the carbon footprint should take into consideration these specificities observed.

1.3. GHG emissions not proportional to energy consumption

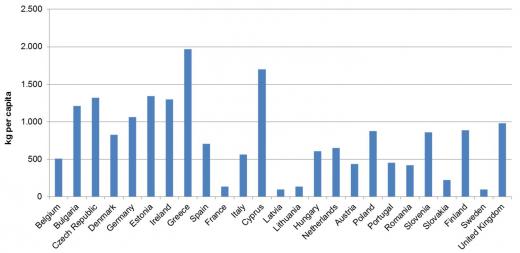
As mentioned above, although the GHG emissions from the household sector are very closely connected to the energy one, their relation is not directly proportional (the higher the consumptions, the higher the emissions), since this is greatly affected by the emission factor for electricity generation, applicable at a national level. For the conversion of electricity generated emissions, presented in Figure 4 below, the standard emission factors were used.
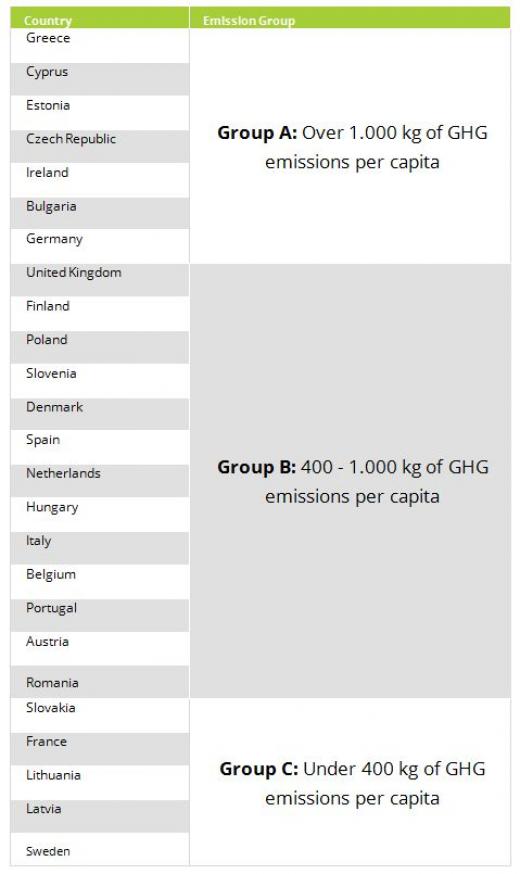
Greece and Cyprus top emission intensity in the household sector
Greenhouse gas emissions in kilograms per capita, in 2012

Greece and Cyprus top emission intensity in the household sector | Greenhouse Gas Emissions in kilograms per capita, in 2012 | Figure 4: GHG emissions per capita from households’ electricity consumption in 2012 | Source: Eurostat database available at http://epp.eurostat.ec.europa.eu/portal/page/portal/energy/data/database (own extrapolation)

Figure 4: GHG emissions per capita from households' electricity consumption in 2012
Source: Eurostat database available at http://epp.eurostat.ec.europa.eu/portal/page/portal/energy/data/database (own extrapolation)
Emission Intensity Ranking
Three emission groups are evident as regards per capita emissions from households’ electricity consumption: the high emission group (Group A), the medium emission group (Group B) and the low emission group (Group C)
 Emission Intensity RankingTable 1: Emission Intensity Ranking | Three emission groups are evident as regards per capita emissions from households’ electricity consumption: the high emission group (Group A), the medium emission group (Group B) and the low emission group (Group C) | Table 1: Households in total contributed around 13% of the direct GHG emissions of the final energy consuming sectors in 2010 | In general, three emission groups are evident as regards per capita emissions from households’ electri
Source: Eurostat database available at http://epp.eurostat.ec.europa.eu/portal/page/portal/energy/data/database

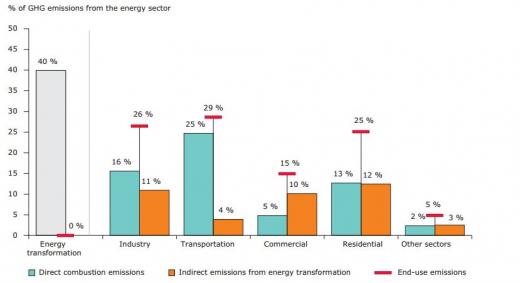
Households in total contributed around 13% of the direct GHG emissions of the final energy consuming sectors in 2010. According to a report by the European Environment Agency (EEA)4, if the indirect emissions, mostly from oil refineries and plants generating electricity and heat, were redistributed in order to calculate the overall emissions linked to each sector, households' contribution would jump to 25%, according to the figure below.

Indirect emissions largely alter sectoral performance in greenhouse gas emissions
Comparison of direct and indirect greenhouse gas emissions per sector
Indirect Emissions largely alter sectoral performance in Greenhouse Gas Emissions | Comparison of direct and indirect Greenhouse Gas Emissions per sector | Figure 5: Sectoral direct and indirect GHG emissions combined | Source: EEA, “End-user GHG emissions from energy: Reallocation of emissions from energy industries to end users 2005–2010”, 2012
Figure 5: Sectoral direct and indirect GHG emissions combined
Source: EEA, "End-user GHG emissions from energy: Reallocation of emissions from energy industries to end users 2005–2010", 2012

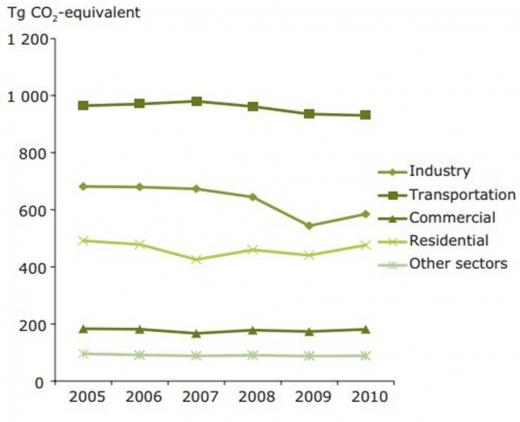
Finally, the household sector's contribution in direct GHG emission generation, against all sectors, is presented in the following Figure 7. The sector ranks third, following transportation and industry.

Residential sector ranks third as GHG emitter, after transport and industry
Sectoral illustration of direct greenhouse gas emissions
Residential sector ranks third as GHG emitter, after transport and industry | Sectoral illustration of direct Greenhouse Gas Emissions | Figure 6: Direct GHG emissions by sector | Source: EEA, “End-user GHG emissions from energy: Reallocation of emissions from energy industries to end users 2005–2010”, 2012
Figure 6: Direct GHG emissions by sector
Source: EEA, "End-user GHG emissions from energy: Reallocation of emissions from energy industries to end users 2005–2010", 2012

2. Policies promoting energy efficiency in households

2.1. Energy efficiency is being tackled on national level

The adoption of the Climate and Energy package for 2020 addressed a number of needs through the adopted directives, such as the reform of the Emissions Trading Scheme of the EU (EU ETS). However, this package did not address energy efficiency, thus leaving unchanged the existing legal framework, comprised mainly of the Directive 2012/27/EU on energy efficiency5, Directive 2010/30/EU on energy labeling of domestic appliances6 and Directive 2010/31/EU on the energy performance of buildings7.

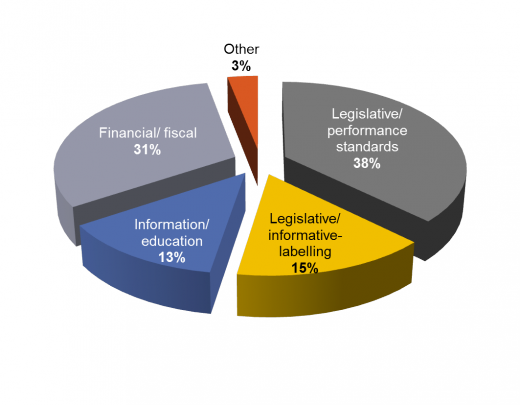
In order to incorporate the aforementioned regulation, all MS have developed strategies to tackle the various sectoral challenges which have been included in the second National Energy Efficiency Action Plans of 2011. In the residential sector EU energy efficiency policies seem to have particularly strong impact as they already represent about one third of all implemented measures at the national level. Specifically, during the last two decades, most of the EU MS have introduced performance standards in buildings, heating systems and electrical appliances, in an attempt to improve the level of residential energy efficiency8. The majority of the EU MS' efforts are of legislative nature, with those of financial nature lagging behind them, closely followed by educational measures.

Legislative measures dominate MS efforts
Instruments and measures implemented in the EU Member States
Legislative measures dominate MS efforts | Instruments and Measures Implemented in the EU Member States | Figure 7: Adopted energy-efficiency policy measures in the EU countries from 1974 to 2016* | Source: Filippini M., Hunt L.C., Zoric J. (2014). Impact of energy policy instruments on the estimated level of underlying energy efficiency in the EU residential sector. Energy Policy, 69, 73-81.
Figure 7: Adopted energy-efficiency policy measures in the EU countries from 1974 to 2016*
*The period refers to the start date of adopted policy measures
Source: Filippini M., Hunt L.C., Zoric J. (2014). Impact of energy policy instruments on the estimated level of underlying energy efficiency in the EU residential sector. Energy Policy, 69, p. 73-81.

2.2. Intensification of efforts is needed

It is a common belief that more efforts are required in order to tap the existing potential through triggering the needed investments. In this respect, some countries have engaged energy utilities or energy service companies (ESCOs), have used national and cohesion funds, or have developed appropriate financial instruments. However, the potential disability to meet the target is claimed to be due not only to the lack of economic viability of investments but because of market failures and regulatory failures as well.

According to the 2013 projections, the MS that are furthest from reaching the 2020 climate targets (with a gap equal or exceeding 5 percentage points) are Malta, Luxembourg, Ireland, Belgium, Spain, Greece, Austria and Lithuania9.

Sources
  • 1. European Commission (2013). Statistical Pocketbook 2013: EU Energy in Figures, online available at: http://ec.europa.eu/energy/sites/ener/files/documents/2013_pocketbook.pdf
  • 2. Joint Research Centre (2012). Energy Efficiency Status Report 2012, online available at: http://iet.jrc.ec.europa.eu/energyefficiency/sites/energyefficiency/file...
  • 3. Eurostat Database, “Electricity consumption by households” (Code: tsdpc310), online available at: http://ec.europa.eu/eurostat/tgm/table.do?tab=table&init=1&language=en&p...
  • 4. European Environment Agency (2012). End user GHG emissions from energy, reallocation of emissions from energy industries to end users 2005-2010, online available at: http://www.eea.europa.eu/publications/end-user-ghg-emissions-energy
  • 5. Directive 2012/27/EU, online available at: http://eur-lex.europa.eu/legal-content/EN/TXT/PDF/?uri=CELEX:32012L0027&...
  • 6. Directive 2010/30/EU, online available at: http://eur-lex.europa.eu/legal-content/EN/TXT/PDF/?uri=CELEX:32010L0030&...
  • 7. Directive 2010/31/EU, online available at: http://eur-lex.europa.eu/LexUriServ/LexUriServ.do?uri=OJ:L:2010:153:0013...
  • 8. Filippini M., Hunt L.C., Zoric J. (2014). Impact of energy policy instruments on the estimated level of underlying energy efficiency in the EU residential sector. Energy Policy, 69, p. 73-81
  • 9. European Commission (2013). Europe 2020 Targets: Climate Change and Energy, online available at: tp://ec.europa.eu/europe2020/pdf/themes/16_energy_and_ghg.pdf
Further Readings 
  • Bertoldi P., Hirl B., Labanca N. (2012). Energy Efficiency Status Report 2012, Electricity Consumption and Efficiency Trends in the EU-27, Joint Research Centre.
  • Broin E., Mata E., Göransson A., Johnsson F. (2013). The effect of improved efficiency on energy savings in EU-27 buildings. Energy, 57, 134-148.
  • De Almeida A., Fonseca P., Schlomann B., Feilberg N. (2011). Characterization of the household electricity consumption in the EU, potential energy savings and specific policy recommendations. Energy and Buildings, 43, 1884-1894.
  • Duarte R., Mainar A., Sanchez-Choliz J. (2013). The role of consumption patterns, demand and technological factors on the recent evolution of CO2 emissions in a group of advanced economies. Ecological Economics, 96, 1-13.
  • European Environment Agency (2012). End-user GHG emissions from energy – Reallocation of emissions from energy industries to end users 2005-2010. Technical report No.18/2012, available at: http://www.eea.europa.eu/publications/end-user-ghg-emissions-energy.
  • Filippini M., Hunt L.C., Zoric J. (2014). Impact of energy policy instruments on the estimated level of underlying energy efficiency in the EU residential sector. Energy Policy, 69, p. 73-81.
  • Gerigk J., Halbritter K., Handgraaf M., Manser J., Ohndorf M., Schubert R. (2012). The current climate and energy policy in the EU and in Switzerland. Working paper, ETH Zurich.
Stakeholder Positions 

Business:

  • European Investments Bank. Press Release: EIB continues to support investments increasing energy efficiency of residential buildings in Bucharest, available at: http://europa.eu/rapid/press-release_BEI-14-172_en.htm

NGOs:

  • WWF: Potential Energy Savings And CO2 Emissions Reduction from Spain's existing residential buildings in 2020, online available at: http://awsassets.wwf.es/downloads/resumen_rehabilitacionviviendas_vfinal...
  • WWF: "How Low? Achieving optimal carbon savings from the UK's existing housing stock", online available at: http://assets.wwf.org.uk/downloads/how_low_report.pdf
  • WWF: Parliamentary Briefing: Minimum standards of energy performance in private housing (2011), online available at: http://assets.wwf.org.uk/downloads/wwf_minimum_standards_briefing_june11...

Governments:

  • UK: Written Ministerial Statement to Parliament by Gregory Barker on the government's energy efficiency strategy update. online available at: https://www.gov.uk/government/speeches/energy-efficiency-strategy-2013-u...
Author 
Charikleia Karakosta
Editor 
Andreas Prahl
Knowledge Package Citation 
Karakosta, Charikleia (2015): "Households' Contribution in the Buildings' Carbon Footprint". Climate Policy Info Hub, 25 March 2015. Online available at: http://climatepolicyinfohub.eu/household-contribution-buildings-carbon-footprint-curtailment-progress
  • Log in to post comments
  • PDF

Issues & Sectors

The Climate Policy Info Hub has been created within the POLIMP project which has received funding from the European Union's Seventh Framework Programme for Research, Technological Development and Demonstration under Grant Agreement Number 603847.

POLIMP Project Logo

Legal Notice • Privacy Notice • Glossary